
What to do about results: set expectations with explanations
What to do about results: set expectations with explanations
What do jurisdictions do in a year when election results simply won’t be complete on Election Night? How states communicate partial or incomplete results can help prevent premature conclusions and misinformation about winners.
This year, many states will be counting many more mail-in (or absentee) ballots than usual due to the pandemic. The surge in ballots will be especially difficult in jurisdictions where procedures and state rules are still designed for much lower participation through mail-in ballots. In many places, results won’t be available until after November 3rd. However, according to research from the Voting Rights Lab, 52% of voters expect results within 3 days of the election.
This means that Election Night Reporting systems, which aggregate results from across a state will become the center of intense attention over what might be a week or more, as voters are counted.
We have combined best practices from our friends at ideas42, The Elections Group and the Voting Rights Lab, along with our own research.
Start with clear communications
Election results reporting has to overcome voter expectations for instant results. Providing the right information during counting can help prevent the spread of misinformation and premature headlines.
The Voting Rights Lab says that “a longer-than-expected wait for results breeds distrust in the election…However, with explanations and messaging, we can effectively [change] voters’ expectations [to accept] an official winner later than it was before.”
They suggest starting with a strong message of the goals of the elections office, such as:
Every eligible voter should have their voice heard and their vote counted. It is going to take longer to count the votes and verify a winner in this year’s election — and that’s okay. Due to coronavirus and health concerns, more people will be voting absentee than ever before.
Other recommendations for overall communications include:
- Strike a calming tone to acknowledge people’s concerns in this moment, but do not reinforce any alarming message that might fuel hopelessness. [VRL]
- Keep key information simple, consistent, and redundant. Deliver concise messages over and over again. “Reinforce in as many ways as possible that accurate results may take several weeks to be fully counted.” [ideas42]
- Reinforce the security of our elections by emphasizing the security measures in place for verifying absentee ballots (but avoid talking about “fraud”). [VRL]
- Write for a general audience, not for election experts. Provide short, clear, definitions of any terms – especially labels for groups of ballots. Links to any videos, diagrams or text pages that will help people who may have never followed election details so closely.
Set expectations
In our decentralized election system, every state has different voting options and procedures, so every site needs to set expectations about the process. This starts by setting expectations based on numbers of mail-in ballots sent and returned and participation through early voting, security procedures in place such as signature verification, and procedures for keeping everyone safe in the coronavirus pandemic.
- Communicate a timeline. Create a visual timeline that shows an ongoing election period. Label November 3rd as “Day 1 results.” [VRL]
- Deliver clear cues to orient people’s expectations. Preview milestones happening in the days and weeks after the election to set accurate expectations. [ideas42]
- Communicate the schedule for updates. Help interested voters and the press know when to check back for the next update.
- Reset people’s expectations early and often: “Offer a clear framework for anticipating the time your state needs to count votes. This framework should be built around objective indicators (ex. number of mail ballots requested, expected proportion of mail ballots, the rules determining when officials can start processing and counting mail ballots).” [ideas42]
Explain the process
Most voters don’t understand how ballots – especially mail ballots – are counted or what goes on behind the scenes. You can demystify this process by explaining it. Show the steps and any estimates you have of how long it takes.
Empower people with concrete information at the right time. Both The Elections Group and Ideas42 recommend over-explaining election processes so they’re concrete and transparent.
- Create a flowchart to show when different groups of ballots are counted and added to the totals.
- Show voters where the counting happens, to make the process more relatable. Consider hosting a virtual tour or providing remote observation on a webcam.
- Emphasize security and control throughout the process and explain how ballots are tracked through the process.
- Explain how problems or exceptions are handled.
Break down the multiple categories of ballots. The Elections Group explains that If voters understand that more than one type of ballot must be counted, they may be less likely to jump to conclusions. Their recommendations include:
- Explain how estimates of ballots waiting to be counted are calculated, especially in the days before the deadline for ballots to be returned.
- Show voters the number of mail-ballots both sent and returned. If possible, compare these numbers to 2016 to convey the magnitude of the increase in requests.
- For ballots returned, show the number accepted, rejected, waiting to be processed, and waiting for a cure (if allowed, until the deadline).
- Report provisionals. Include those received, counted, and rejected because not registered, or rejected because a mail-ballot was already counted.
- Explain what happens to ballots that change status, including provisional and mail-in ballots. If ballots are in a cure process, for example, this should be indicated.
Put the results in context
As results start coming in, put them in context by showing what the numbers are based on. For example, voters may not know that different counties will count at different paces.
Start with a summary, then show or link to a breakdown by county for those who want specific details.
- Show percentages of the number of voters, not just the number of districts or counties.
- Combine early vote counts with information on the number of outstanding mail ballots.
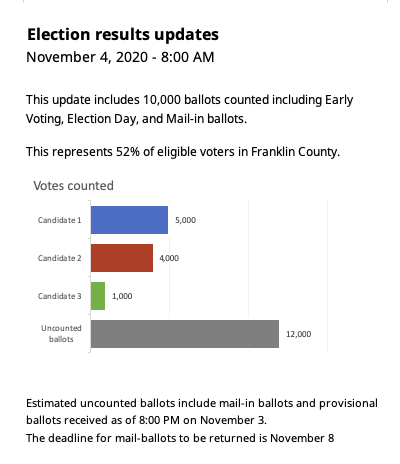
Show the number of ballots counted out of the total number of ballots, so that it’s easier to see how many more ballots still need to be counted.
- Include information about any ballot processing policies that may affect the total number of ballots, such as the deadline for receiving ballots from the post office.
- Before the deadline for receiving mail ballots: 100% = early voting + election day voting + mail ballots sent to voters
- After the deadline: 100% = early voting + election day voting + mail ballots received
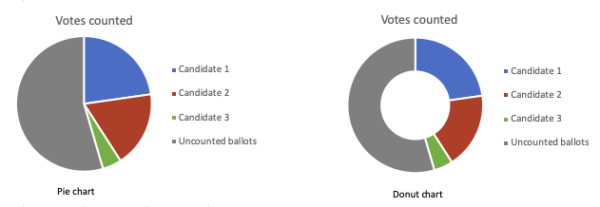
Use visualizations to help voters understand incomplete results. This can apply to the numbers of ballots, or to comparing votes for candidates to the number of uncounted ballots remaining.
- Donut charts are easier to read than pie charts as a way to show the numbers as part of 100% of the ballots. It helps voters see how the numbers add up. In the examples below, showing how many more ballots are left to be processed makes it clear that the margin between the two leading candidates is insignificant compared to the uncounted ballots.
- Add text to give any chart or table context, making the textual explanations as prominent as the visual charts.
- Whether you simply list the number of uncounted ballots or display it in the same format as counted ballots, be sure it is easy to find, especially in the early days of canvass.
Resources
Download an election results mock-up for your website. – Powerpoint file following recommendations for both text and visualizations – US Digital Response and CCD
Managing Expectations for Slower Elections Results in 2020 – The Election Group
Brain, Meet Modern Journalism – Elizabeth Weingarten and Omar Parbhoo, ideas42
Managing Expectations for Election Results – Voting Rights Lab
Technology and Voting webinar with Charles Stewart III, Dan Wallach and Liz Howard at University of Dayton – includes discussion of election night reporting
Resources from election offices
Arapahoe County Mail Ballot Processing – An infographic of the steps from ballot collection to reporting results
Los Angeles County Presidential Primary Semi-Final Results. A news release summarizing an interim release of results.
Design principles for ranked-choice voting results – Research-based guidelines that include reporting results that show all of the counting steps of ranked-choice voting.
How Ohio is changing their results display for 2020 – Video of the Secretary of State explaining how results will be reported
North Carolina voter turnout statistics – Pre-election day data (also see the link to the timeline)
Colorado graphic summary of turnout (as of 10/27) – from the Secretary of State’s daily summary press release. Includes total ballots returned, trend lines, total active voters.
Have you seen a great official election results display? Let us know on Twitter @civicdesign
© 2025 Center for Civic Design