
Text on the left or right – which works better?
Text on the left or right – which works better?
Which works better – left or right-justified text?
The New Hampshire ballots are laid out with each party in its own column, including a large group of State Representatives, elected at-large. State election law says that the ovals must be placed to the right of the candidate names. But how should the text be laid out?
- With the names lined up on a left margin, it’s easy to read down the column, because the text starts in the same place on the row.
- Lining the names up next to the ovals makes a stronger connection between the oval and the text.
Usability tests provide data to answer questions
To answer this question, volunteers from the UXPA Usability in Civic Life project and the Brennan Center conducted a usability test. The test was conducted on the day of the primary election, near two polling places. As voters left the polls, they were approached and asked if they would be willing to participate. By the end of the day, 100 people took part in the test.
The New Hampshire Secretary of State Department prepared two test ballots using races that would appear on the general election ballot in November and fictitious names. Participants used both ballots to vote (alternating which one they used first). They were given instructions for how to vote, including deliberate undervotes and write-in candidates.
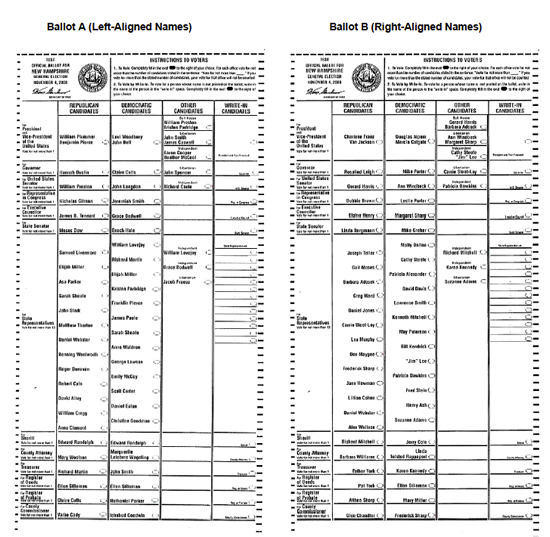
The two ballots had the same layout, but with different names. Ballot A has the names aligned on the left of the column. Ballot B has the names aligned to the right, next to the marking oval.
What were the results?
In the end, the data suggested that the strong proximity relationship between the candidate name and the fill-in ovals on Ballot B is more important than the horizontal alignment of the names.
Participants:
- Took slightly longer to complete the voting tasks on Ballot A than on Ballot B.
- Made more errors on Ballot A (116) than on Ballot B (92).
- Expressed equal satisfaction with both ballot styles.
- Preferred Ballot B (44) over Ballot A (28), with 28 expressing no preference.
Although the difference in the number of errors made by participants when voting on Ballot A and Ballot B is not statistically significant, the data indicates a trend toward fewer errors when voting on Ballot B.
We recommended the use of Ballot B for the November general election.
Read the full report: New Hampshire Comparison of Ballot Styles (pdf)
Credits
The usability tests were conducted by Sarah Swierenga and Kyle Soucy, Usability in Civic Life; Margaret Chen, Andrew Stengel, Brennan Center for Justice; Laura Snow, Franklin Pierce Law Center; and local volunteers and polling location moderators who assisted with recruiting.
© 2025 Center for Civic Design