
Testifying to the PCEA: Looking across the voter experience
Testifying to the PCEA: Looking across the voter experience
I wanted the U.S. Presidential Commission on Election Administration and the rest of the audience on September 4, 2013 in Philadelphia to take a step back from examining individual activities (for example, registering, voting absentee, etc.) that might have contributed to long lines at the polling place in November 2012. There’s a lot of, “Nope, that’s not it, maybe it’s this other thing.” Instead, I wanted to give everyone a way to think about usability and accessibility in the voter experience as measurable and holistic. So, I gathered up data from our (now famous) county election website study and observations from 100s of hours in polling places across the team, and I presented the voter experience as a hero’s journey.
The journey that voters take through preparing and then voting at the polling place
Presentation with audio description
Transcript
[Slide 1] Commissioners, thank you for this chance to talk with you today. To the election officials here and in the audience, thank you for doing amazing work. I know that for many local election officials, a good election is a done election. The research from my team, and many people who have gone before us, shows that
[Slide 2] good elections reflect clear processes, efficient, effective poll workers, and the importance of usability and accessibility across the voter experience.
[Slide 3] A good election has clear, verifiable results
[Slide 4] in which the margin of victory is larger than the number of residual votes. Clear, verifiable results come from
[Slide 5] the voter carrying out intent. As my team likes to say, cast as intended
[Slide 6] counted as cast.
[Slide 7] I’m Dana Chisnell, and the talented team at the Center for Civic Design has put a couple of studies together to visualize the voter experience for you today.
[Slide 8] In our research in the fall of 2012, we asked, What questions do people have about the upcoming election? Our study had a small convenience sample of 41 participants, who were geographically diverse. They used their own county’s website to answer their questions. There were a lot of interesting findings about the usability of county election websites, but what is relevant today are the questions participants asked.
[Slide 9] The most asked question was, What is on the ballot?
[Slide 10] We also have spent more than 100 hours over the last 9 months studying how elections work on Election Day by being in polling places for elections large and small across the country. Now, let’s have a look at the journey the voters went through based on our data and observations.
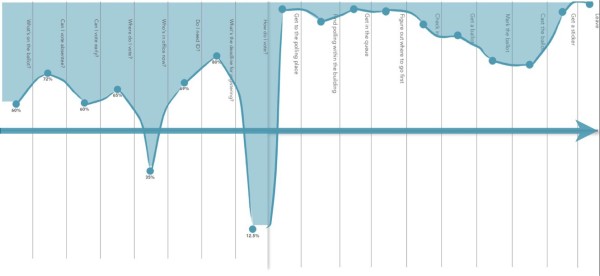
[Slide 11] Across our journey map at intervals are the questions voters asked. These represent activities — something a voter might do to get their questions answered. So, let’s see how well the sites did.
[Slide 12] The county election websites helped 60% of our participants who asked the question find out what was going to be on their ballot.
- 72% found information about voting absentee.
- 60% of the participants who asked whether they could vote early found their answers on county web sites.
- County websites helped 65% find where their polling place was.
- However, only 35% of those who asked learned who their current representatives were from their county websites.
- 69% got an answer to whether they needed a voter ID,
- and we were delighted to see that 80% of participants who asked questions about registering to vote or about their registration status did find answers to those questions on their county’s site.
But in preparing to vote, one other question came up for many of our participants: How do I actually vote? They wanted to know what to expect at the polling place, and what the voting system would actually be like. Tragically, this question went unanswered for all but about 13% of the participants who wanted to find the answer to this question on their county website.
If we look at the journey through answering these questions, it’s easy to see that, first, the best we got was 80% success on one question. There are a couple of sizable dips, too. Ideally, you’d want everyone to find their answers.
[Slide 13] And when we fill this space, we can see how far we have to go to improve the experience at which points. This filled space is actually the window of opportunity — there’s a lot of the franchise in that space. It’s the room for improvement. Now let’s look at voting at a polling place.
[Slide 14] Same basic format, but as we’re basing this map on observational data, I’ll show you a composite visualization that depicts one of the typical voter paths.
[Slide 15] The voter gets to the polling place. If they’re driving, there’s parking to find, which can be tough in some urban places. Signage probably helps them find their way to the right entrance, but unless there’s a queue, finding the exact location of polling can be challenging.
Arriving in the room where polling is happening, the voter has to figure out where to go first. If there are multiple precincts or election districts housed in the same polling place, they often don’t know which is theirs, go to the wrong one, and get redirected. Eventually, they get checked in, get a ballot, and then head to a voting booth…
[Slide 16] … where we encounter the death of a thousand cuts that is the ballot. For many voters, this is the first time they see what is on the ballot. The voter has to figure out how to mark the ballot, and choose which contests to vote in. There’s pressure to complete the entire ballot, but some voters don’t feel comfortable voting in contests where they don’t know the issues or candidates. They wonder if their votes will count if they don’t vote the entire ballot.
Having many different kinds of contests on the ballot can also slow voters down. If there are contests on the second side of a printed ballot, voters may forget or not realize that they need to vote on those, too. Finally, they finish marking the ballot.
[Slide 17] The voter casts the ballot. If there’s a tabulator, they may get a message from it if they’ve overvoted or undervoted, and will have some decisions to make about what to do. In some cases, they may get the ballot back to spoil, replace, and vote again. When completely done casting, the voter gets a sticker , and leaves. So that’s the big picture of what a voter goes through. The specific steps may be slightly different, or in a different order, but elections are nothing if not ritualistic. And this map doesn’t account for a voter showing up at the wrong polling place, or having to vote on a provisional ballot. Or voting on an accessible system.
[Slide 18] This is what you might call the “happy path” — the optimal steps for a voter to follow, and yet we can see that our observations suggest it’s not perfect. It’s pretty good, though, and some of the issues are easily correctible.
[Slide 19] For example, many jurisdictions have put a greeter at the main entrance to direct people to the correct precinct right away. Having a well-trained greeter or team of greeters closes that gap. And then we’re left with voters’ direct interaction with the ballot.
[Slide 20] These kinds of maps are tools for benchmarking the experience voters are having now, and measuring improvements over time.
[Slide 21] To close the gaps, there are simple questions to ask. They might seem obvious, but when you specifically test for them, and measure voter success, you can also take remedial action. For example, my team, in developing the Field Guides To Ensuring Voter Intent, ends each Field Guide with a checklist like this one.
[Slide 22] To close the gap, the Field Guides offer evidence-based prescriptive steps for improving design, usability, and accessibility that virtually any jurisdiction can implement within the constraints they face in election code, voting systems, and resources.
[Slide 23] Design, usability, and accessibility are vital across the voter experience. When a voter can prepare efficiently and vote effectively, election administration works well, too. Conducting simple checks for usability and accessibility can be quick, inexpensive, and lead to continuing improvement election to election. We urge the Commission to use a similar approach in its final report of best practice recommendations. And we encourage local jurisdictions to call on their communities to help them run these checks.
[Slide 24] Thank you.
Resources
- Video of testimony at the PCEA website
- Slides accompanying testimony to the PCEA (PDF or PPT)
- Written testimony (PDF)
© 2025 Center for Civic Design