
Research for media reporting on RCV elections
Research for media reporting on RCV elections
How do we make sure voters understand ranked choice voting election results displays? Thousands — if not millions — of voters turn to media reporting to find out the results of an election. Our research looked at the best practices to communicate RCV election results. We wanted to learn what design choices make it easiest for voters to understand results and what confuses them.

Media RCV Results Explainers Part 1
Download report
Media RCV Results Explainers Part 2
Download reportKey findings
In the first part of our research, we tested a variety of ways press articles display the results RCV elections using 10 samples. In the second part, we narrowed the sample displays we tested down to two.
Here are a few of our key findings:
Most participants described their favorite samples as “simple.”
- By simple, they meant that the results were quick to scan through.
- Even in less popular samples, checkmarks were cited as simple elements within a complex layout.
- Most participants cited samples with many data sets as unnecessary, overly complex, and for academics.
Maps give context to understand election results.
- Most participants mentioned that a map helps them understand data
“I didn’t choose this in my top [choices] because there was nothing I could associate with. Some pictures. Like who’s who, or who’s on top, or a picture of Alaska”
Research participant
For election results displays, people look at visuals first, then at the header, then text.
The information about the election should include:
- Office
- Location
- Status of results
Information about RCV should include:
- A definition of what inactive ballots are and what happens with them
- How many rounds there were by numbering them
About this research
This research was conducted by Emma Werowinski and Fernando Sánchez.
What did we want to learn?
- Which best practices help people understand RCV election results?
- Do people understand the status of the results?
- Do people understand who won and how?
What kind of testing did we do?
We conducted intercept tests in NYC.
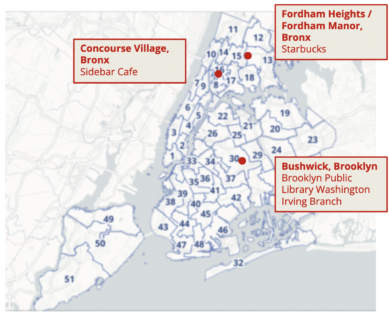
Where we tested
We tested in neighborhoods that had low-ranking participation in 2021:
- Bushwick, Brooklyn
- Concourse Village, Bronx
- Fordham Heights/Fordham Manor, Bronx
Related research
This research was the basis for our best practice guide. Read our guidelines for news articles about RCV results. For a shorter version, you can check out our article summarizing the highlights from this guide.
Visit our full page on ranked choice voting to find more resources about designing ballots, voter education, and election results for ranked choice voting.
© 2025 Center for Civic Design