Initial observations and insights about ranked choice voting from a flash usability test
This is a report from one of our first usability tests of RCV ballots, conducted in California in 2012. What we heard in this testing reminded us how important good design is in helping people use new ways of voting to have their voices heard. See our updated RCV best practices and recent research.
Background and participants
Our convenience sample was intercepted from people who were in proximity, were willing to spend 15-20 minutes with us, and who were positively inclined toward people asking them to help us learn about ballot design. We had 40 participants in 6 locations.
Participants voted on the Alameda County demonstration ballot and the Portland, Maine ballot from 2011. We alternated which ballot participants got first.
Most participants were active voters:
- 20 participants said they voted in November 2011.
- 9 last voted in 2010.
- 7 last voted in the presidential election in 2008.
- 1 last voted in 2009.
- 1 was registered but did not provide data about when he last voted.
- 2 were not registered to vote.
The youngest participant was 19. The oldest was 84. The average age was 43.
Highlights
- These participants took voting seriously; many said they prepare ahead, but some said they don’t.
- Voters don’t read instructions (hence, voter education is probably not the only answer).It’s unclear that reading the instructions for ranked choice voting would help people vote as they intend, because the instructions are only about how to mark the ballot, not about how the votes are counted or what the consequences of ranking are.In addition, the instructions and explanation of ranked choice voting are separate from the ballot or too far away from where and how voters make their ranking decisions.
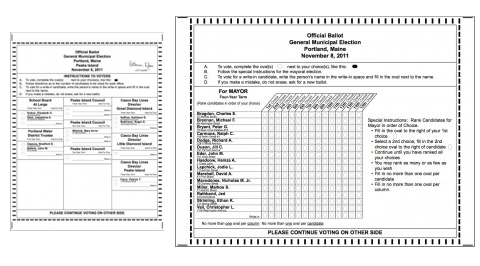
- Design did help in conveying the behavior needed – that is, the Maine ballot was more suggestive of the activity of ranking choices than the Alameda one was. At least one person used the Maine ballot as a worksheet, and hoped that by doing so she wasn’t invalidating her vote. Here’s what happened:
1. Marked the names of people she definitely didn’t want to vote for (referencing the sheet with position statements)
2. Made little 1,2,3 marks for the ones she wanted to rank that way
3. Voted according to her marks
4. Used the instructions on the right hand side rather than the ones at the top, and was annoyed to later notice that they were incomplete (missing the write-in part)
Note: This participant voted by mail last time.
- The design of the Maine ballot worked so well to suggest ranking, that participants thought they had to rank all of the candidates.
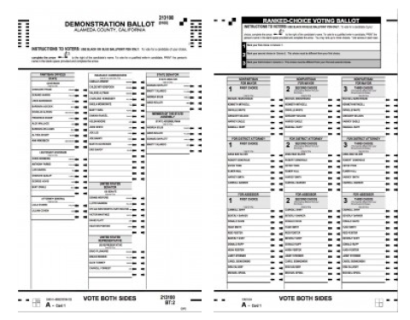
- Several participants marked the Alameda ranked choices down the columns rather than across the contests. When we asked them about this, some portion of those voters admitted that they hadn’t realized at first that the rankings went across. We don’t know yet whether participants were more likely to navigate this way if they voted the other side first.
- Testers reported that participants said they were using the lowest rankings (10-15) on the Maine ballot to register their disapproval of the candidate.
- It was not uncommon for participants to describe their #3 choice on the Alameda ballot as “throw-away.”
- Many participants marked only 1 or 2 choices.
- Some participants remarked that because they didn’t understand how the votes were counted that they didn’t trust the system. Others said that even though they didn’t understand exactly how votes were counted that they trusted that election officials to count votes appropriately. We’ll look more closely at how many people expressed these opinions and whether there’s any effect for age, race, zip code, or voting history.
- Very few people accurately described how ranked choice votes are counted, even in zip codes with high education and socio-economic levels; people in poorer neighborhoods had even more difficulty describing how their ranked choices were counted. Most of these participants had voted in the most recent election. In Rockridge, most of the participants said they’d voted in the Oakland mayoral election in 2010. One participant in Oakland was a congressional aide who was tentative about his understanding of how ranked choice voting worked.
- Many participants, who did describe the counting process accurately, weren’t confident in their knowledge.
- Many participants theorized that ranked choice operates on a weighted or point system. A few participants suggested that it was for breaking ties, but they could not describe how the second place votes were tallied. It was not uncommon for participants to talk themselves into corners as they tried to describe how the counting was done. Most ended with “I don’t know.”
- Participants voted counter to their intentions with ranked choice voting. For example, with the Maine ballot, a few teams reported that participants chose the “worst” candidates and ranked them last. They shouldn’t have ranked them at all.
- Some participants were put off when they learned how the counting worked. As one team lead said, participants said ranked choice voting seemed almost un-democratic to them. Several people had visceral negative reactions. As soon as he saw the ballot, one participant remarked, “I hate ranked choice voting!”
- A few participants marked the ballots incorrectly, including people who said they were active voters — though intent was usually clear.
I plan to do another, follow-up study in which we have people vote ranked choice. The idea is to show participants a tested description of how their rankings are counted, and have them say in their own words how counting works, and then have them vote again with this new knowledge.
Here are images of the ballots we used. One was a demonstration ballot provided by Alameda County. The other was two pages of the Portland, Maine ballot from November 2011.
You can read more about flash testing in Wilder than testing in the wild: usability testing by flash mob